Tour of the Invisible Universe
For the Tour of the Invisible Universe (Activity 4 in the Invisible
Universe GEMS Teacher's Guide), the best way to display the images
is by color computer display with a videoprojector or directly
on-screen. As promised in the "What You Need" section
on page 58 of the teacher guide, we provide an electronic file
in PDF format that can be used with Adobe Acrobat Reader here.
(If you are unable to download the 1.5 MB file, links to the images
are also provided below.)
Once you open the file in Adobe Acrobat, choose "Full Screen"
in the "View" menu, and the image will appear maximum
size with an elegant black background. Use the arrow keys on your
computer to scroll through as you present the pages. When you're
done, just press the "esc" key to exit.
As referenced in the text in the sidebar at the top of page 59,
the following is for teachers who would like to present more detailed
information during the the "Tour of the Universe" than
that outlined in the tour narration cards on pages 63 through
66 of the guide. The information can be added to that provided
on the narration cards. By exploring the source pages for the
images you can find further information regarding the images and
their subjects, providing for as detailed a discussion as your
students demand. Selecting any of the smaller images below will
open a larger version of that same image. Selecting the link will
take you to the page where the image was originally posted.
1. Moon
2. Sun
3. Jupiter
4. Great Nebula in Orion (M42)
5. Cat’s Eye Nebula (NGC6543)
6. Crab Nebula
7. Globular Cluster (M15)
8. Supernova 1987A
9. The Whirlpool Galaxy (M51)
10. Black Hole Causes Jet in Galaxy M87
11. Gamma-ray Burst (GRB991216)
12. The Early Universe
|
|
1. Moon–Distance: 380,000
km (240,000 miles)
|
|
Top image (visible light)
Image Source:
http://nssdcftp.gsfc.nasa.gov/photo_gallery/image/planetary/moon/gal_moon_color.jpg
This color image of the Moon was taken by the Galileo spacecraft
at 9:35 a.m. PST Dec. 9, 1990, at a range of about 350,000 miles.
The color composite uses monochrome images taken through violet,
red, and near-infrared filters. The concentric, circular Orientale
basin, 600 miles across, is near the center; the near side is to
the right, the far side to the left. At the upper right is the large,
dark Oceanus Procellarum; below it is the smaller Mare Humorum.
These, like the small dark Mare Orientale in the center of the basin,
formed over 3 billion years ago as basaltic lava flows. At the lower
left, among the southern cratered highlands of the far side, is
the South-Pole-Aitken basin, similar to Orientale but twice as great
in diameter and much older and more degraded by cratering and weathering.
The cratered highlands of the near and far sides and the Maria are
covered with scattered bright, young ray craters.
|
 |
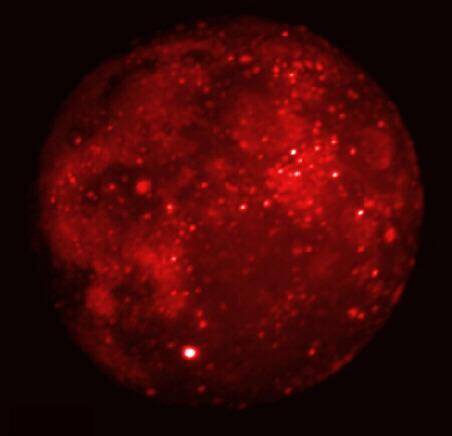
Bottom image (infrared light)
Image Source: http://antwrp.gsfc.nasa.gov/apod/ap970110.html
The Midcourse Space Experiment (MSX) satellite had a spectacular
view of the lunar eclipse of Jan 10, 2021 from Earth orbit, with
the Moon completely immersed in the Earth’s shadow. Its onboard
infrared telescope, was used to repeatedly image the Moon during
the eclipse. The bright spots correspond to the warm areas on the
lunar surface, dark areas are cooler. The brightest spot below and
left of center is the crater Tycho, the dark region at the upper
right is the Mare Crisium. The series of SPIRIT III images allow
the determination of cooling curves for geologically different areas,
exploring the physical properties of the Moon’s surface. Eclipsed
Moon in Infrared Credit: DCATT Team, MSX Project, BMDO.
|
 |
2. Sun–Distance:
about 150,000,000 km (93,000,000 miles)
|
|
Top image (visible light)
Image Source: This image no longer available on-line.
Sunspots can be seen to rotate across the surface of the Sun, revealing
that our Sun spins, completing a rotation about every 28 days. The
Exploratorium website has an excellent section on sunspots at http://www.exploratorium.edu/sunspots/
See also http://www.lhs.berkeley.edu/SII/URLs/NASAsunearth.html
for more links as well as some solar observatory websites:
* Amateur Solar Observatory -- http://home.worldonline.nl/~slooten
* Big Bear -- http://www.bbso.njit.edu
* Birmingham Solar Oscillations Network -- http://bison.ph.bham.ac.uk
* Mees Solar Observatory http://www.solar.ifa.hawaii.edu/Daily/mees_obs.html
* Mt. Wilson Observatory 150-ft Solar Tower -- http://www.astro.ucla.edu/~obs/intro.html
* National Solar Observatory -- http://www.nso.edu/
* SOHO (NASA-European Space Agency Solar Heliospheric Observatory):
http://sohowww.nascom.nasa.gov/
|
 |
Middle image (infrared)
Image Source: http://umbra.gsfc.nasa.gov/images/latest_nsoHe.gif
The infrared image shows granulation in the Sun’s surface.
Granulation is evidence of upward and downward currents of gas (convection
currents) within the Sun. While visible ligth images show sunspots
well, IR images show prominences, which look like tongues of flame
sticking out of the edge of the Sun. They are very different from
flames that we are familiar with on Earth.
|
 |
Bottom image (X-ray)
Image Source: http://cfa-www.harvard.edu/cfa/hotimage/trace.html
The image in our tour is from the YOHKOH spacecraft. For more on
Yokoh mission, see
http://www.lmsal.com/SXT/homepage.html
|
 |
3. Jupiter–Distance:
about 400,000,000 km (250,000,000 miles)
|
|
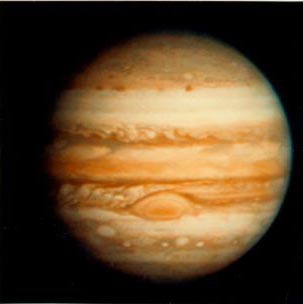
Top image (visible light)
Image Source: http://www.windows.ucar.edu/tour/link=/jupiter/images/jupiter_ir_vis_image.html&edu=high
The Red Spot is the largest known storm in the Solar System. With
a diameter of 15,400 miles, it is almost twice the size of the entire
Earth and one-sixth the diameter of Jupiter itself. Unlike a low-pressure
hurricane in the Caribbean Sea, however, the Red Spot rotates in
a counterclockwise direction in the southern hemisphere, showing
that it is a high-pressure system.
The long lifetime of the Red Spot may be due to the fact that Jupiter
is mainly a gaseous planet. It possibly has liquid layers but lacks
a solid surface, which would dissipate the storm's energy, much
as happens when a hurricane makes landfall on the Earth. However,
the Red Spot does change its shape, size, and color, sometimes dramatically.
Such changes are demonstrated in high-resolution Wide Field and
Planetary Cameras 1 & 2 images of Jupiter obtained by NASA's
Hubble Space Telescope, which can be found at [original image: 9929a.jpg]
by the Hubble Heritage Project team.
Astronomers study weather phenomena on other planets in order to
gain a greater understanding of our own Earth's climate. Lacking
a solid surface, Jupiter provides us with a laboratory experiment
for observing weather phenomena under very different conditions
than those prevailing on Earth. This knowledge can also be applied
to places in the Earth's atmosphere that are over deep oceans, making
them more similar to Jupiter's deep atmosphere.
|
 |
Middle image (radio)
Image Source: http://www.nrao.edu/imagegallery/php/level3.php?id=22
The bright central region is due to thermal radiation from Jupiter’s
atmosphere. The bright features beyond the disk are due to radiation
emitted by fast moving electrons trapped in Jupiter’s magnetic
field. This radiation is mainly concentrated along Jupiter’s
magnetic equator, but is also at higher magnetic latitudes as seen
by the two "horns". From the US National Radio Astronomy
Observatory.
|
 |
Bottom image (X-ray)
Image Source: http://chandra.harvard.edu/photo/2002/0001/0001_xray.jpg
|
 |
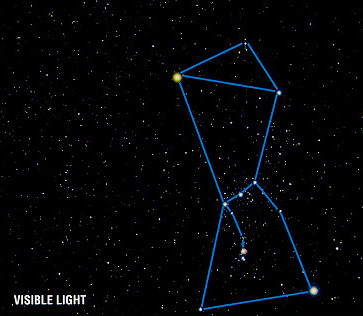
4. Great Nebula in Orion–Distance:
1,400 light years
|
|
Top image (visible light)
Image Source: http://sirtf.caltech.edu/Media/gallery/orion.jpg
The Great Nebula in Orion is the finest example of a diffuse nebula
in the sky and one of the most beautiful objects one can see, even
in a relatively small telescope. It is a vast cloud of glowing gases,
mostly hydrogen, of immensity beyond comprehension, and birthplace
of stars.
Tennyson, often called "The Poet of Science," said this
of the Great Nebula:
"…A single misty star
Which is the second in a line of stars
That seem a sword beneath a belt of three,
I never gazed upon it but I dreamt
Of some vast charm concluded in that star
To make fame nothing…"
"…regions of lucid matter taking form,
Brushes of fire, hazy gleams,
Clusters and beds of worlds, and bee-like swarms
Of suns and starry streams…"
From Merlin and Vivien.
Closeup images by Hubble Space telescope (see http://hubblesite.org/gallery/showcase/nebulae/n5.shtml),
show especially dense clouds of molecular hydrogen gas (two atoms
of hydrogen in each molecule) and dust that are shaped by a flood
of ultraviolet light from hot, massive newborn stars. This process
is called "photoevaporation." This ultraviolet light is
also responsible for illuminating the convoluted surfaces and ghostly
streamers of gas that highlight the three-dimensional nature of
the clouds.
As parts of the nebula is slowly eroded away by the ultraviolet
light, small globules of denser gas buried within the nebula are
uncovered. These globules have been dubbed "EGGs," an
acronym for "Evaporating Gaseous Globules," forming inside
at least some of the EGGs are embryonic stars -- stars that abruptly
stop growing when the EGGs are uncovered and they are separated
from the larger reservoir of gas from which they were drawing mass.
Eventually, the stars themselves emerge from the EGGs as the EGGs
themselves succumb to photoevaporation.
|
 |
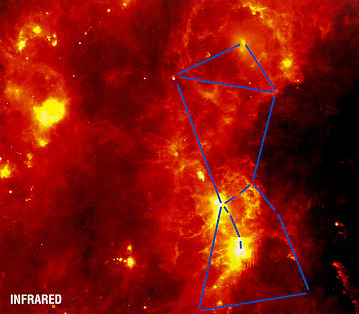
Middle image (infrared)
Image Source: http://sirtf.caltech.edu/Media/gallery/orion.jpg
The familiar winter sky constellation Orion takes on a spectacular
guise in the infrared, as seen in this false-color image constructed
from data collected by IRAS--the Infrared Astronomical Satellite.
The warmest features, e.g. the stars, are brightest. This emission
is coded blue. The interstellar dust is cooler (coded green and
red).
The bright yellow region in the lower right of the picture is the
Sword of Orion, containing the Great Orion Nebula (M42 and M43).
Above it to the left is the nebulosity around the belt star Zeta
Orionis which contains the often photographed Horsehead Nebula (barely
visible as a small indentation on the right side). Higher and to
the left is M78, a reflection nebula. The Rosette Nebula is the
brightest object near the left margin of the picture.
Most of the visually bright stars of Orion are not prominent in
the infrared. However, Betelgeuse can be easily seen in the upper
center of the picture as a blue-white dot (the faint tail is an
instrumental artifact). The large ring to the right of Betelgeuse
is the remnant of a supernova explosion, centered around the star
Lambda Orionis. These rings are quite common in the IRAS sky. Another
one, fainter and larger, can be seen in the lower left quadrant
of the image.
|
 |
|
Bottom image
Image Source: http://chandra.harvard.edu/press/00_releases/press_110900.html
To see the whole Orion Nebula region in X-ray see:
http://www.msfc.nasa.gov/news/photos/photogallery/chandra/chandra5.htm
This X-ray image, shows about a thousand X-ray emitting young
stars in the Orion Nebula star cluster. The X rays are produced
in the multimillion degree upper atmospheres of these stars. At
a distance of about 1800 light years, this cluster is the closest
massive star forming region to Earth. It is well-known in the
night sky because it illuminates the Orion Nebula. The region
shown in this image is about 10 light years across. The bright
stars in the center are part of the Trapezium, an association
of very young stars with ages less than a million years. The dark
vertical and horizontal lines, and the streaks from the brightest
stars are instrument effects.
The Orion Trapezium cluster is a group of very young stars concentrated
in a region only 1.5 light years across at the core of the Orion
Nebula star cluster. The Trapezium cluster offers a prime view
into a stellar nursery. It is composed of stars with a median
age of around 300,000 years, and at a distance of 1400 light years,
is one of the nearest star-forming regions to Earth. The Chandra
X-ray Observatory identified X-ray emission from individual stars
in the Trapezium for the first time and found that almost all
of their upper atmospheres, or coronas, are much hotter than expected.
Chandra also detected several stars that are still surrounded
by protoplanetary disks, for example the blue object on the lower
left.
Chandra X-ray Observatory ACIS Image (Credit: NASA/MIT/N.Schulz
et al.)
|
 |
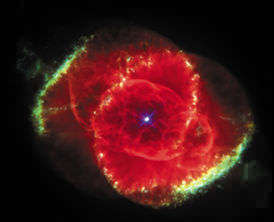
5. The "Cat’s Eye"
Nebula (NGC6543)–Distance: 3,000 light years
|
|
Top image (visible light)
Image Source: http://hubble.stsci.edu/discoveries/hstexhibit/stars/stardeath.shtml
The Cat's Eye Nebula is in the class of nebulae known as Planetary
Nebulae, which are associated with dying stars. The name "planetary
nebula" is very misleading, since they have almost nothing
to do with planets. The name was given to this class of nebula by
early observers who used telescopes in which the disk-shaped planetary
nebulae resembled planets. A planetary nebula is actually tunnels
of gas cast off by a dying red giant star over a period of thousands
of years. The dying central star, which ultimately becomes a white
dwarf star, can sometimes be seen in the center of the planetary
nebula.
Perhaps the most famous example of a planetary nebula is the Ring
Nebula (M57) which is about a light-year in diameter, and located
some 2,000 light-years from Earth in the direction of the constellation
Lyra. See a Hubble Space Telescope view of M57, at 00000. Look for
the colors that represent three different chemical elements: helium
(blue), oxygen (green), and nitrogen (red).
|
 |
Middle image (infrared)
Image Source: not available |
 |
Bottom image (X-ray)
Image Source:
http://heasarc.gsfc.nasa.gov/docs/objects/heapow/archive/stars/chandra_catseye.html
A planetary nebula forms when a dying red giant star puffs off its
outer layer, leaving behind a hot central core. Scale: Images are
30 arcsec a side.
|
 |
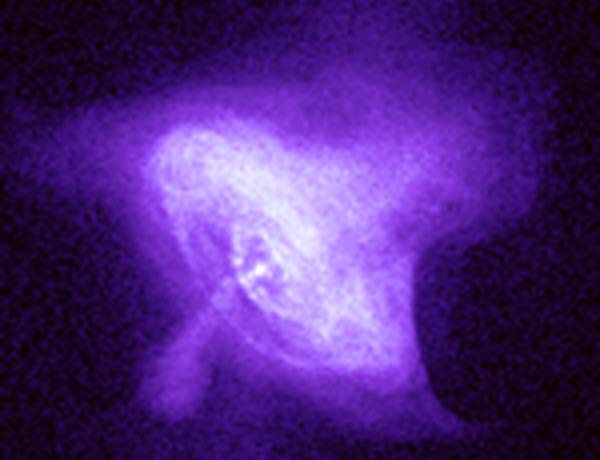
6. Crab Nebula (M1)–Distance:
6,500 light years
|
|
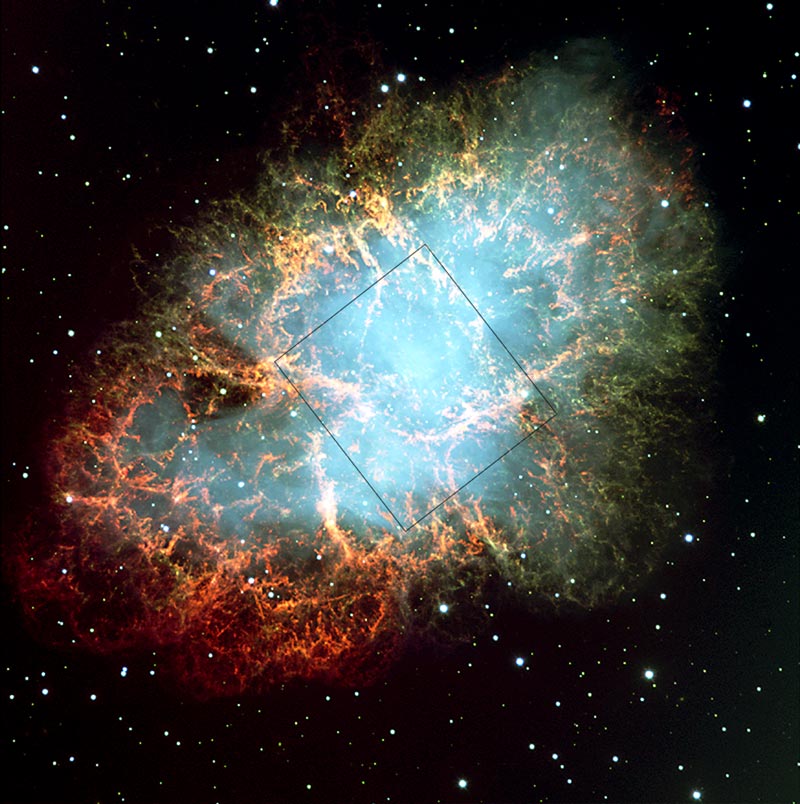
Top image (visible light)
Image Source: No longer available.
Located about 6,500 light-years from Earth in the direction of the
constellation Taurus, the Crab Nebula is the remnant of a star that
began its life with about 10 times the mass of our own Sun. Such
a massive star consumes its nuclear fuel so rapidly that it lives
only some 50 million years before exploding as a supernova. For
the Crab star, the end came on July 4, 1054. The explosion was witnessed
as a naked-eye "Guest Star" by Chinese astronomers. Some
researchers believe it is also depicted in rock paintings of Native
Americans in the southwestern United States.
The spinning pulsar heats its surroundings, creating the ghostly
diffuse bluish-green glowing gas cloud in its vicinity, including
a blue arc just to the right of the neutron star. The colorful network
of filaments is the material from the outer layers of the star that
was expelled during the explosion and is now expanding outward at
high speed, approaching some 300 miles per second. The pulsar has
about 1.4 times the mass of the Sun, but jammed into an object only
about 10 miles in diameter. This incredible object, a "neutron
star," is even more remarkable because it spins on its axis
30 times a second.
NASA’s Hubble Space Telescope (HST) zoomed in on the center
of the Crab to reveal its structure with unprecedented detail. See:
http://hubblesite.org/newscenter/archive/2000/15/
The HST Crab Nebula image was obtained by Hubble’s Wide Field
and Planetary Camera 2 in 1995. Images taken with five different
color filters have been combined to construct this false-color picture.
Resembling an abstract painting by Jackson Pollack, the image shows
ragged shreds of gas that are expanding away from the explosion
site at over 3 million miles per hour. The core of the star has
survived the explosion as a "pulsar," visible in the Hubble
image.
In the HST picture, look for various colors that arise from different
chemical elements in the expanding gas, including hydrogen (orange),
nitrogen (red), sulfur (pink), and oxygen (green). The shades of
color represent variations in the temperature and density of the
gas, as well as changes in the elemental composition. These chemical
elements, some of them newly created during the evolution and explosion
of the star and now blasted back into space, will eventually be
incorporated into new stars and planets. Astronomers believe that
the chemical elements in the Earth and even in our own bodies, such
as carbon, oxygen, and iron, were made in other exploding stars
billions of years ago.
|
 |
|
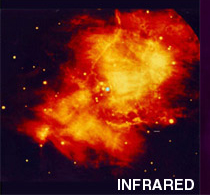
Middle image (infrared)
Image Source: http://www.aip.org/png/html/crabneb.html
For an excellent discussion of the Crab Nebula in IR and other
wavelengths, see the SIRTF mission web page: http://sirtf.caltech.edu/EPO/Messier/m1.html
|
 |
|
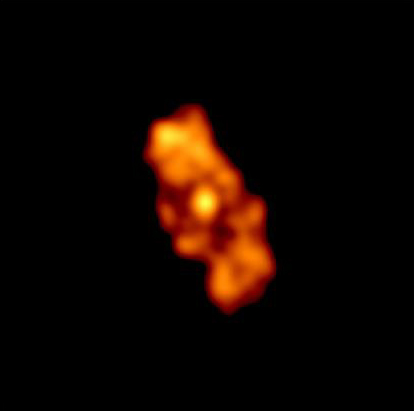
Bottom image (X-ray)
Image Source: http://antwrp.gsfc.nasa.gov/apod/ap990929.html
This picture by the recently launched Chandra X-Ray Observatory
shows new details of the nebula's center in X-ray light, yielding
important clues to how the neutron star powers the nebula. Visible
are rings of high-energy particles that are being flung outward
near light-speed from the center, and powerful jets emerging from
the poles. Astrophysicists continue to study and learn from this
unusual engine which continually transfers 30 million times more
power than lightning at nearly perfect efficiency.
|
 |
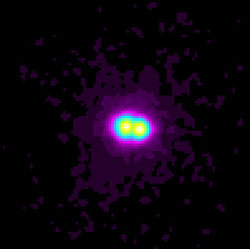
7. Globular Star Cluster
M15–Distance: 34,000 light years
|
|
Top image (visible light)
Image Source: http://zebu.uoregon.edu/messier.html
This stellar swarm is M15, one of the147 known globular star clusters
in the Milky Way galaxy. M15 contains hundreds of thousands of stars,
all held together by their mutual gravitational attraction. Globular
clusters are particularly useful for studying stellar evolution,
since all of the stars in the cluster have the same age (about 15
billion years), but cover a range of stellar masses. Every star
visible in this image is either more highly evolved than, or in
a few rare cases more massive than, our own Sun.
|
 |
Bottom image (X-ray)
Image Source: http://chandra.harvard.edu/photo/cycle1/m15/
Chandra X-ray Observatory Center
Harvard-Smithsonian Center for Astrophysics
Chandra's image of a puzzling X-ray source in the globular star
cluster M15 shows that it is not one neutron star binary system,
but two neutron star binary systems that appear so close together
(2.7 seconds of arc) that they were indistinguishable with previous
X-ray telescopes. In the 1970's astronomers discovered one neutron
star binary system in M15, called 4U2127, with the Uhuru X-ray satellite.
Subsequent data from X-ray telescopes indicated that the neutron
star itself was not directly visible in X-ray light because it was
hidden by an accretion disk of hot matter swirling from a companion
star onto the neutron star. This picture was put into doubt when
the Japanese Ginga X-ray satellite saw luminous X-ray bursts from
the region in 1990. The length of the burst and other light characteristics
implied that the surface of the neutron star was directly visible,
in contradiction with earlier observations.
Chandra observations solved this mystery. The source could exhibit
two contradictory modes of behavior because 4U2127 is not one source,
but two: one whose neutron star is hidden by an accretion disk (on
the left in the image), and one (right) where occasional X-ray outbursts
reveal another neutron star's surface.
The broader implication of the Chandra discovery is that binary
star systems with a neutron star orbiting a normal star may be common
in globular clusters. Previously, and inexplicably, astronomers
had never seen more than one of these neutron star binaries in any
one globular cluster–a tight spherical region that can contain
a million stars or more.
|
 |
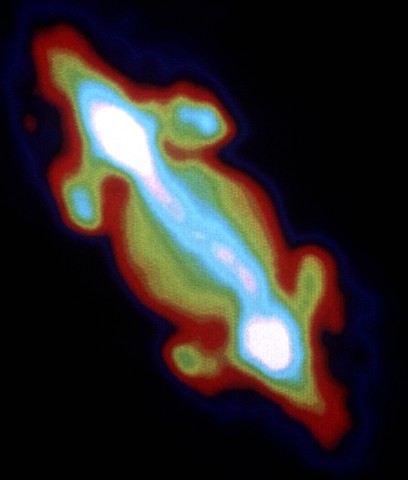
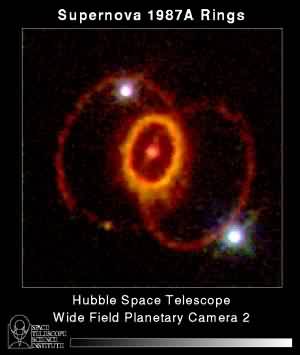
8. Supernova 1987A–Distance:
168,000 light years
|
|
Top image (visible light)
Image Source: http://chandra.harvard.edu/photo/cycle1/sn1987a/sn1987a_tiled.jpg
Glittering stars and wisps of gas create a breathtaking backdrop
for the self-destruction of a massive star, called supernova 1987A,
in the Large Magellanic Cloud, a nearby galaxy. Astronomers in the
Southern hemisphere witnessed the brilliant explosion of this star
on Feb. 23, 1987. In this NASA Hubble Space Telescope (HST) image,
the supernova remnant, surrounded by inner and outer rings of material,
is set in a forest of ethereal, diffuse clouds of gas.
This three-color HST image is composed of several pictures of the
supernova and its neighboring region taken with the HST Wide Field
and Planetary Camera 2 in Sept. 1994, Feb. 1996 and July1997. The
many bright blue stars nearby the supernova are massive stars, each
more than six times heftier than our Sun. With ages of about 12
million years old, they are members of the same generation of stars
as the star that went supernova. The presence of bright gas clouds
is another sign of the youth of this region, which still appears
to be a fertile breeding ground for new stars. In a few years the
supernova’s fast moving material will sweep the inner ring
with full force, heating and exciting its gas, and will produce
a new series of cosmic fireworks that will offer a striking view
for more than a decade.
|
 |
Middle right image (radio)
Image Used: http://chandra.harvard.edu/photo/cycle1/sn1987a/sn1987a_tiled.jpg
The Supernova 1987A shock wave is evident in this radio telescope
image also.
|
|
Bottom left image (X-ray)
Image Used: http://chandra.harvard.edu/photo/cycle1/sn1987a/sn1987a_tiled.jpg
This false-color image from the Chandra X-ray Observatory reveals
a one light-year diameter ring of hot, ten million degree plasma.
It is one of the most detailed X-ray images of the expanding blast
wave from supernova 1987A (SN1987A). Superposed on this image are
white contour lines which outline the innermost optical ring as
seen by the Hubble Space Telescope. The composite picture clearly
shows that the X-ray emitting shocked material lies just inside
the optical ring. In fact, the X-ray emission seems to peak (whitest
color) close to where the optical emission peaks (closely spaced
contours), a persuasive demonstration that the optical light is
produced as the blast wave plows into surrounding material.
What will SN1987A look like in the future? According to a popular
model, in coming years the expanding supernova blast wave should
hit and light up even more material while the violent impacts send
reverse shocks back towards the site of the explosion and light
up the ejected stellar debris. In any event, astronomers will watch
eagerly from a ringside seat as a new supernova remnant emerges.
|
|
Bottom right image (visible)
Image Used: http://hubblesite.org/newscenter/archive/1994/22/
|
 |
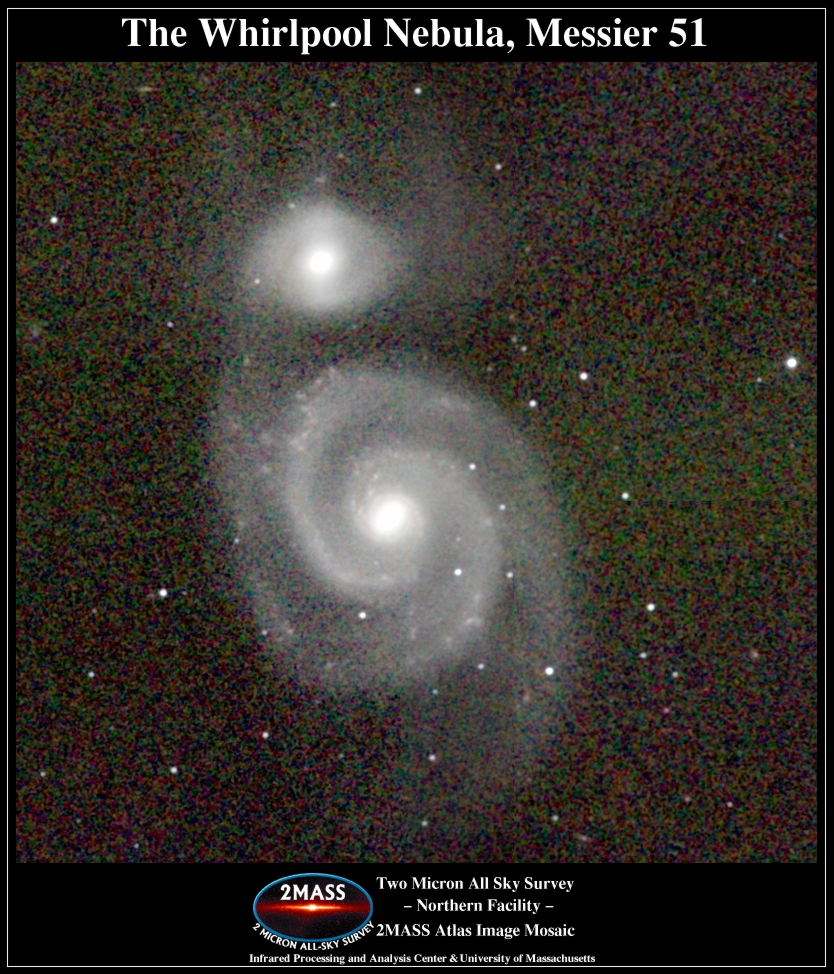
9. The Whirlpool Galaxy
(M51)–Distance: 37 million light years
|
|
Top image (visible light)
Image Source: http://sirtf.caltech.edu/Education/Messier/m51.html
See also http://seds.lpl.arizona.edu/messier/m/m051.html
The famous Whirlpool galaxy M51 was one of Charles Messier's original
discoveries: He discovered it on October 13, 1773, when observing
a comet, and described it as a "very faint nebula, without
stars" which is difficult to see. Its companion, NGC 5195,
was discovered in 1781 by his friend, Pierre Méchain, so
that it is mentioned in his 1784 catalog: `It is double, each has
a bright center, which are separated 4'35". The two "atmospheres"
touch each other, the one is even fainter than the other.' NGC 5195
was assigned an own number by William Herschel: H I.186.
This galaxy was the first one where the spiral structure was discovered,
in spring 1845 by Lord Rosse, who made a very careful and acurate
painting. Therefore, M51 is sometimes referenced as Rosse's Galaxy
or Lord Rosse's "Question Mark" - he is cited with this
name (see, e.g., NED).
According to our present understanding, the pronounced spiral structure
is a result of M51's current encounter with its neighbor, NGC 5195.
Due to this interaction, the gas in the galaxy was disturbed and
compressed in some regions, resulting in the formation of new young
stars. As is common in galactic encounters, spiral structure is
preferably induced in the more massive galaxy.
|
 |
Middle left image (Near IR)
Image Source: http://www.ipac.caltech.edu/2mass/gallery/m51atlas.jpg
Two-Micron All-Sky Survey (2MASS)
The near-infrared (NIR) image was obtained by the Two-Micron All-Sky
Survey (2MASS), an ongoing effort to map the entire sky at J-band
(1.25 microns), H-band (1.65 microns) and K-band (2.17 microns)
wavelengths. The 2MASS survey is led by the University of Massachusetts,
with all data and images processed at Caltech's Infrared Processing
and Analysis Center (IPAC). The survey utilizes two nearly identical
1.3-meter diameter telescopes located on Mount Hopkins (Arizona)
and on Cerro Tololo (Chile). Exposure times are 7.8 seconds.
|
 |
Middle center image (Mid-IR)
Image Source: http://www.iso.vilspa.esa.es/science/galleries/nor/M51.html
ESA's Infrared Space observaotry (ISO)
The nearby Whirlpool Galaxy, M51, was ISO's "first light"
target on 28 November, when the telescope was opened to the sky.
The infrared image shows regions of star formation along the galaxy's
spiral arms and on either side of the nucleus.
|
 |
Middle right image (Far IR)
Image Source: http://sirtf.caltech.edu/EPO/Messier/m51.html
InfraRed Astronomical Satellite(IRAS)
The far-infrared image was obtained with the InfraRed Astronomical
Satellite (IRAS) in 1983. This was the first space-borne infrared
astronomy satellite, and was an international collaboration between
the US, the Netherlands and the UK. IRAS mapped nearly the entire
sky at four wavelengths, including 60 microns (millionths of a meter)
and 100 microns in the far-infrared. Since infrared detector technology
was still relatively immature at the time of this path-breaking
mission, the spatial resolution for the mid-IR images is rather
modest. The IRAS detectors were rectangular in shape, and had relatively
large fields of view (about 1.5 arcmin wide and 4.7 arcmin long
at 60 microns, and 3 arcmin by 5 arcmin at 100 microns). The far-IR
images depicted in the Museum resulted from high-resolution processing,
in which sky coverage and sophisticated mathematical algorithms
combine to yield effective resolutions of better than 1 arcmin.
The odd elliptical shape of many mid-infrared emission peaks is
a consequence of the underlying rectangular detectors used by IRAS.
|
 |
Bottom left image (Radio)
image Source: http://www.mpifr-bonn.mpg.de/staff/wsherwood/Images/m51cm20i.gif
National Radio Astronomy Observatory Very Large Array (VLA)
|
 |
Bottom right image (X-ray)
Image Source: No longer available on line.
An even better image of M51 in X-ray is at http://antwrp.gsfc.nasa.gov/apod/ap020711.html
The popular pair of interacting galaxies known as the Whirlpool
is imaged here at high energies by the orbiting Chandra X-ray Observatory.
Still turning in a remarkable performance, over 80 glittering x-ray
stars are present in the Chandra image data from the region. The
number of luminous x-ray sources, likely neutron star and black
hole binary systems within the confines of M51, is unusually high
for normal spiral or elliptical galaxies and suggests this cosmic
whirlpool has experienced intense bursts of massive star formation.
The bright cores of both galaxies, NGC 5194 and NGC 5195 (right
and left respectively), also exhibit high-energy activity in this
false-color x-ray picture showing a diffuse glow from multi-million
degree gas. An expanded view of the region near the core of NGC
5194 reveals x-rays from a supernova remnant, the debris from a
spectacular stellar explosion, first detected by earthbound astronomers
in 1994.
|
 |
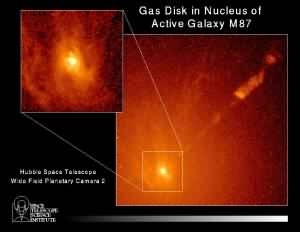
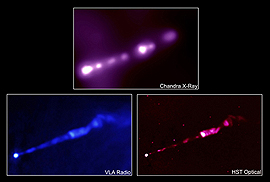
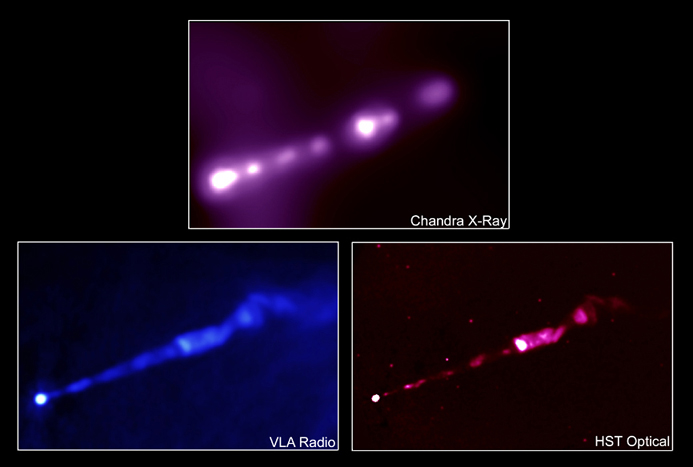
10. Jet in Galaxy M87–Distance:
50 million light years
|
|
Top image (visible light)
Image Source: http://hubblesite.org/newscenter/archive/1994/23/
Hubble Space Telescope
Astronomers using the Hubble telescope have found seemingly conclusive
evidence for a massive black hole in the center of the giant elliptical
galaxy M87, located 50 million light-years from Earth in the constellation
Virgo. Earlier observations suggested that the black hole was present,
but they were not decisive.
This observation provides very strong support for the existence
of gravitationally collapsed objects, which were predicted 80 years
ago by Albert Einstein's general theory of relativity. This image
shows a spiral-shaped disk of hot gas in the core of M87. Hubble
measurements indicate that the disk's rapid rotation is strong evidence
that it contains a massive black hole. A black hole is so massive
and compact that nothing can escape its gravitational pull, not
even light.
|
 |
Bottom middle image (X-ray)
Image Source: http://xrtpub.harvard.edu/photo/cycle1/0134/index.html
Chandra X-ray Observatory Center
Harvard-Smithsonian Center for Astrophysics
NASA's Chandra X-ray Observatory has given astronomers their most
detailed look to date at the X-ray jet blasting out of the nucleus
of M87, a giant elliptical galaxy 50 million light years away in
the constellation Virgo. The X-ray image of the jet reveals an irregular,
knotty structure similar to that detected by radio telescopes and
the Hubble Space Telescope. At the extreme left of the image, the
bright galactic nucleus harboring a supermassive black hole shines.
The jet is thought to be produced by strong electromagnetic forces
created by matter swirling toward the supermassive black hole. These
forces pull gas and magnetic fields away from the black hole along
its axis of rotation in a narrow jet. Inside the jet, shock waves
produce high-energy electrons that spiral around the magnetic field
and radiate by the "synchrotron" process, creating the
observed radio, optical and X-ray knots. Synchrotron radiation is
caused by high-speed charged particles, such as electrons, emitting
radiation as they are accelerated in a magnetic field.
|
 |
Bottom left image (radio)
Image Source: http://xrtpub.harvard.edu/photo/cycle1/0134/m87comp.jpg
National Radio Astronomy Observatory Very Large Array (VLA)
An excellent link for further research is http://www.aoc.nrao.edu/epo/pr/1999/m87/.
At the center of M87, material being drawn inward by the strong
gravitation of the black hole is formed into a rapidly-spinning
flat disk, called an accretion disk. The subatomic particles are
thought to be pushed outward from the poles of this disk. Scientists
believe that magnetic fields in the disk are twisted tightly as
the disk spins and then channel the electrically-charged particles
into a pair of narrow jets.
M87 is one of the nearest jet-emitting galaxies and its strong radio
emission made it an excellent target for radio telescopes. Both
radio observations with the VLBA and optical observations with the
Hubble Space Telescope have measured the motions of concentrations
of material in M87's jets, and have shown the material to be moving
at apparent speeds greater than that of light. This "superluminal"
motion is a geometric illusion created by material moving nearly,
but under, the speed of light, but in a direction somewhat toward
the Earth.
M87 also is known by radio astronomers as Virgo A, the strongest
emitter of radio waves in the constellation Virgo. The galaxy was
discovered by the French astronomer Charles Messier in 1781. The
jet was first seen in 1918 by Lick Observatory astronomer Heber
Curtis, who described it as "a curious straight ray."
The galaxy's radio emission was first observed by Australian astronomers
in 1948/49. M87 is the largest of thousands of galaxies in the Virgo
Cluster of galaxies.
|
|
Bottom right image (visible light)
Image Source: http://hubblesite.org/newscenter/archive/2000/20/
Hubble Space Telescope
|
|
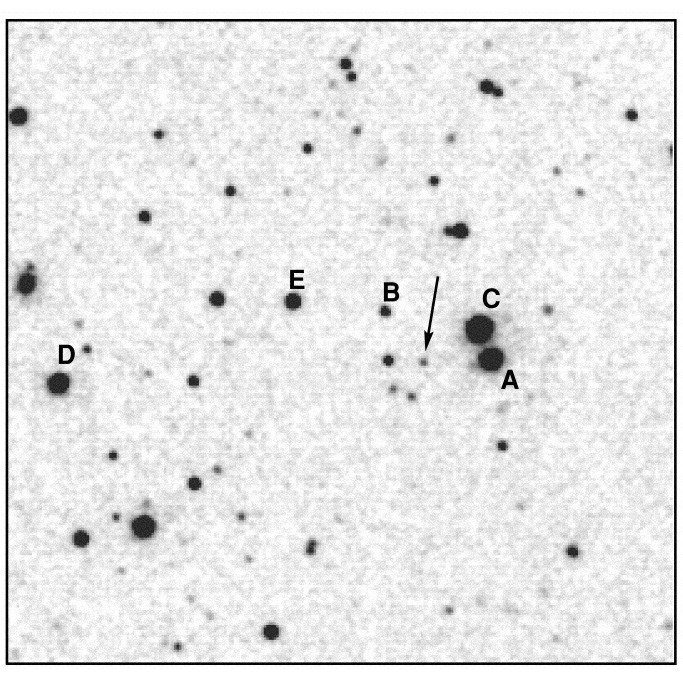
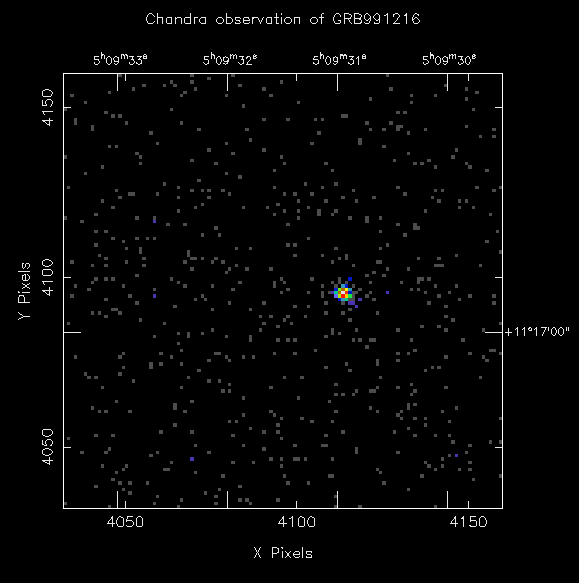
11. Gamma Ray Burst 991216–Distance:
several billion light years
|
|
|
Top image (visible light)
Image Source: http://chandra.harvard.edu/photo/cycle1/0596/0596_optical.jpg
"The energy released by this burst in its first few seconds
staggers the imagination," said Caltech professor Shrinivas
Kulkarni, one of the two principal investigators on the Hubble
Space Telescope team that captured this image. The burst appears
to have released several hundred times more energy than an exploding
star, called a supernova, until now the most energetic phenomenon
in the universe known to scientists.
"For about one or two seconds, this burst was as luminous
as all the rest of the entire universe," said Caltech professor
George Djorgovski, the other principal investigator on the team.
Finding such large energy release over such a brief period of
time is unprecedented in astronomy, except for the big bang itself.
"In a region about a hundred miles across, the burst created
conditions like those in the early universe, about one millisecond
(1/1,000 of a second) after the big bang," said Djorgovski.
Gamma-ray bursts are mysterious flashes of high-energy radiation
that appear from random directions in space and typically last
a few seconds. They were first discovered by U.S. Air Force Vela
satellites in the 1960s. Since then, numerous theories of their
origin have been proposed, but the causes of gamma-ray bursts
remain unknown. NASA’s Compton Gamma-Ray Observatory (CGRO)
satellite detected several thousand bursts in its 9-year lifetime.
Swift will detect hundreds more following its launch in 2003.
|
 |
Bottom image (X-ray)
Image Source: http://chandra.harvard.edu/photo/cycle1/0596/0596_xray_grb.jpg
Chandra X-ray Observatory HETG/ACIS (Credit: NASA/CNR/L.Piro et
al)
This gamma-ray burst exploded roughly 8 billion years ago. An international
team of researchers used the Chandra X-ray Observatory to detect
never-before-seen properties in the X-ray afterglow of a gamma-ray
burst (GRB). GRBs are mysterious blasts of high-energy radiation,
believed to be the most powerful explosions in the Universe. Chandra’s
latest discovery of iron in the ejected material surrounding GRB991216
strengthens the case for a "hypernova" model for GRBs.
In this theory, GRBs are caused by massive stars that collapse under
their own weight, releasing gigantic amounts of energy.
|
 |
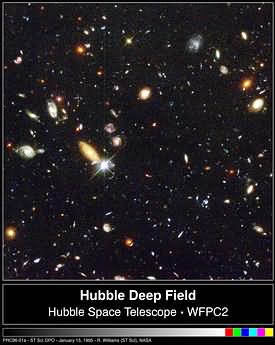
12. The Early Universe: Hubble
Deep Field
|
|
Top (visible light)
Image Source: http://hubblesite.org/newscenter/archive/1996/01/
Hubble Space Telescope (HST)
Several hundred never before seen galaxies are visible in this "deepest-ever"
view of the universe, called the Hubble Deep Field, made with NASA’s
Hubble Space Telescope. Besides the classical spiral and elliptical
shaped galaxies, there is a bewildering variety of other galaxy
shapes and colors that are important clues to understanding the
evolution of the universe. Some of the galaxies may have formed
less that one billion years after the Big Bang. Representing a narrow
"keyhole" view all the way to the visible horizon of the
universe, the Hubble Deep Field image covers a speck of sky 1/30th
the diameter of the full Moon. About 25% of the entire Hubble Deep
Field is shown here.
This is so narrow, just a few foreground stars in our Milky Way
galaxy are visible and are vastly outnumbered by the menagerie of
far more distant galaxies, some nearly as faint as 30th magnitude,
or nearly four billion times fainter than the limits of human vision.
(The relatively bright object with diffraction spikes just left
of center may be a 20th magnitude star.) Though the field is a very
small sample of sky area it is considered representative of the
typical distribution of galaxies in space because the universe,
statistically, looks the same in all directions.
The image was assembled from many separate exposures (342 frames
total were taken, 276 have been fully processed to date and used
for this picture) with the Wide Field and Planetary Camera 2 (WFPC2),
for ten consecutive days between December 18 to 28, 1995. This picture
is from one of three wide-field CCD (Charged Coupled Device) detectors
on the WFPC2.
This "true-color" view was assembled from separate images
taken in blue, red, and infrared light. By combining these separate
images into a single color picture, astronomers will be able to
infer — at least statistically — the distance, age, and
composition of galaxies in the field. Bluer objects contain young
stars and/or are relatively close, while redder objects contain
older stellar populations and/or are farther away.
|
 |
|
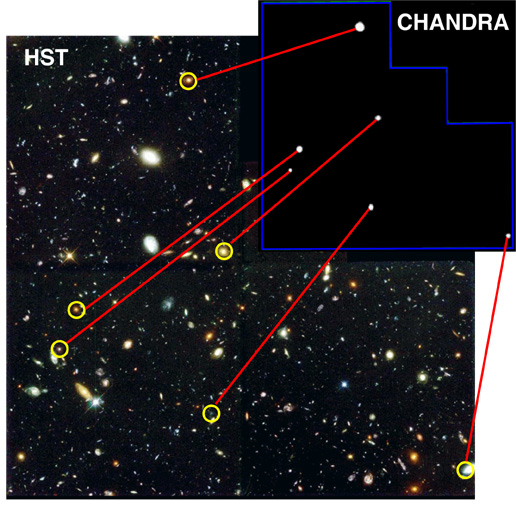
Bottom (X-ray)
Image Source: http://chandra.harvard.edu/photo/cycle1/hdfn/hdfnchandra.jpg
Chandra X-Ray Observatory ACIS Image; (Credit: Optical: NASA/HST,
X-ray: NASA/PSU)
This image shows the results of the first long-duration (approx.
46 hour) X-ray survey of the Hubble Deep Field North. Chandra
detected X rays from six of the galaxies in the field. The X-ray
emitting objects discovered are a distant galaxy thought to contain
a central giant black hole, three elliptically shaped galaxies,
an extremely red distant galaxy, and a nearby spiral galaxy. A
surprise result that must be studied further is the lack of X
rays from some of the extremely luminous submillimeter galaxies
at huge distances (over 10 billion light years) from earth. The
Chandra results raise questions about the current theories used
to explain the high energy output of these objects.
Scale: Image is 1 arcmin on a side.
Copyright Information for Hubble Images: Material credited to
STScI on this site was created, authored, and/or prepared for
NASA under Contract NAS5-26555. Unless otherwise specifically
stated, no claim to copyright is being asserted by STScI and it
may be freely used as in the public domain in accordance with
NASA’s contract. However, it is requested that in any subsequent
use of this work NASA and STScI be given appropriate acknowledgement.
STScI further requests voluntary reporting of all use, derivative
creation, and other alteration of this work. Such reporting should
be sent to copyright@stsci.edu.
Hubble Space Telescope publicly released images may be found at
http://hubblesite.org/newscenter/.
If the credit line for an image lists STScI as the source, the
image may be freely used as in the public domain as noted above.
However, for credit lines listing individuals from other institutions,
you will need to contact that institution listed in the credit
line to advise you on the copyright policy for that image.
|
 |
|


